As we explained before, insurance companies work over large amount of customers. Whilst they may suffer the odd set-back here and there, on average, they’ll make more money than they’ll lose. So what happens if you don’t have a large amount of customers? What if you can only base your estimation for someone’s death on a handful of people?
For example, if we continue with the hypothetical Mrs Smith, among her more obvious lifestyle and health choices and predicaments, there was also be some more unique and niche variable that will affect Mrs Smith’s life expectancy. Perhaps, the fact that she eats granola for breakfast, or that she has two children, or the fact that one of those two children is a boy and one is a girl, etc. These variables will inevitably have an effect on Mrs Smith’s life expectancy, however small that effect may be, and can therefore be used to better estimate her time of death. But we previously used data from lots and lots of people to deduce a life expectancy, so what happens when we don’t have lots and lots of people to base our estimation on? As we slowly include more and more variables into our estimation for Mrs Smith, we are steadily reducing the number of people we can base our estimation on. Eventually, we could introduce so many variables, that Mrs Smith is the only person who we can use for our estimation. But our estimation is supposed to be for Mrs Smith in the first place!
This means that we must decide how many people in a sample are required before we can produce an accurate estimation. The small samples mean we’ve been able to include lots of information about a person when making our guess, but big samples mean we’ve got lots of people to base our average on. So where do we strike our balance? Let’s find out.
We’ll start by taking a sample from our original graph. Each time, we’ll increase the number of individuals in the sample, and see what that does to our graph.
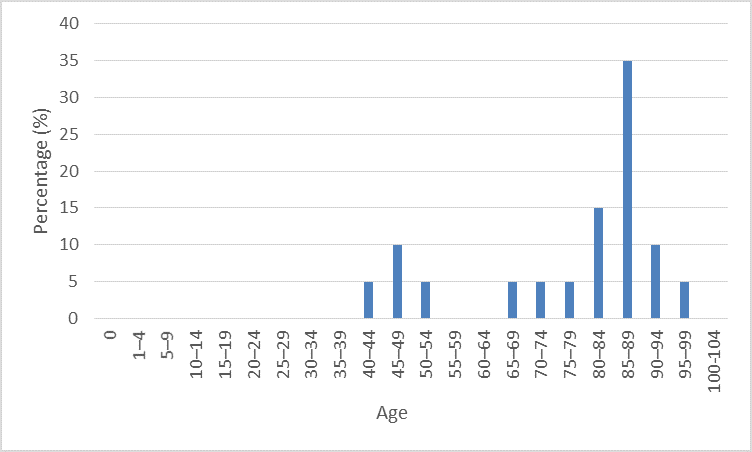
10 individuals
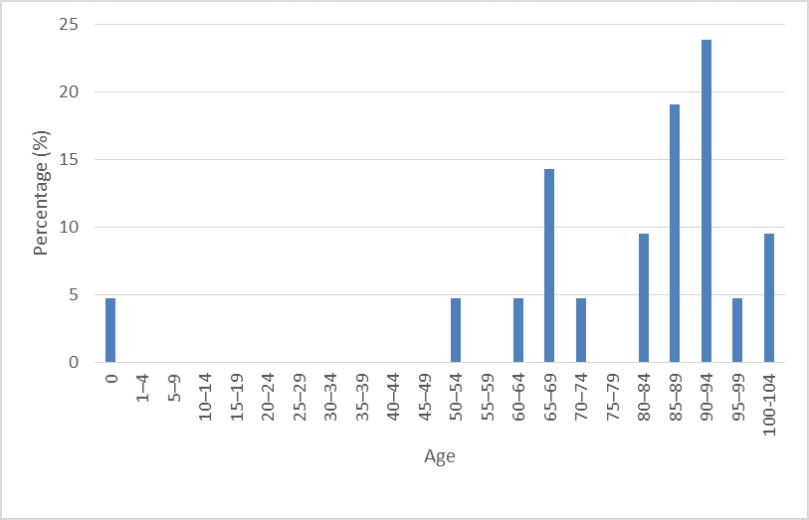
20 individuals
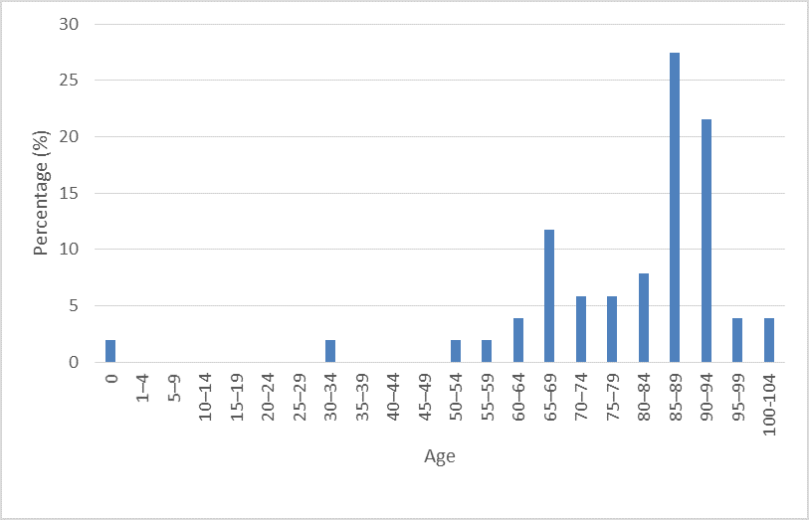
50 individuals
100 individuals
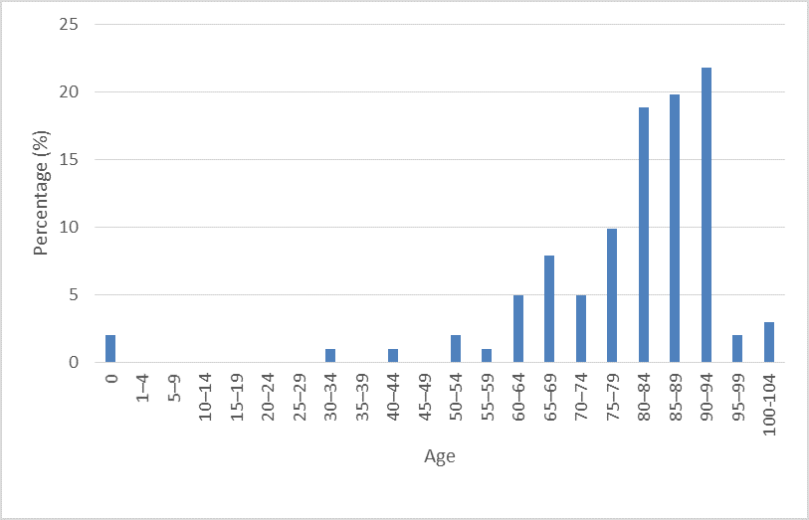
As you can see, as the size of our sample increases, we start to see a distribution closer to what we know to be the real distribution. But when the samples are small, we see discrepancies, and outliers have a larger effect on our data. For example, with only 20 individuals, our data suggests that an individual has a 5% chance of dying before the age of 1. As the size of our sample increases however, this percentage drops dramatically. Furthermore, within each of these samples, the mean (and subsequently what we use to guide our estimate) varies, despite the fact that all the individuals have come from the same sample. In short then, it’s better to base your estimates on lots of examples, rather than just one.
But then it’s more specific to any given case to use samples with similar instances, which are inevitably smaller. To illustrate this, I’m going to devise a hypothetical challenge. Imagine you’ve been asked to estimate how many daisies there are in a field. You are not given access to the field, but you are told some features about it (it’s got a large tree in the middle, rain is common, it’s near a beach, etc.). In addition to this information, you are given access to a number of other fields, which all vary on their similarity to the field you are burdened with. Some are also near a beach, some are not. Some have a large tree in the middle, others do not. A few have both a large tree in the middle and are near a beach, but the majority do not. You are told to use these fields to make your estimation. How would you go about making your estimation? Do you…
1: Measure everything?
You measure the number of daisies in every single field, regardless of their similarity. You plot your findings into a large graph and (very much as we did with life expectancy) you find an average. You use this average as your estimation. You do this despite the fact that some of the fields bear very few similarities to the field you need to make the estimation for.
Or do you…
2: Only measure those which closest resemble the field requiring the estimate?
Instead of measuring every single field, you decide that you only need to measure the one that is most similar. As it happens, there is a single field which has all of the same features. You measure the number of daisies in that field, and use that number for your estimation. You do this hoping that the field you measured is not an anomaly, but is average for a field of that type.
As you may have guessed, it would probably be most correct to something in the middle. You want to measure enough fields so ensure that your answer is reliable and less influenced by outliers, but you also want to measure fields that resemble the one you need to make the estimation for, so that features that aren’t present in the field we need to make the estimation for (containing a different species of grass for example), aren’t used when we make our estimation.
And very much the same logic applies to our life insurance problem. There isn’t a single sample size that can be brandished as being “correct” or reliable. Instead, a trade-off occurs. On the one hand, we want to use data as specific to each individual as possible, but on the other, we want to be able to make estimates that will be as correct as possible, and not be influenced by outliers or anomalies.
In truth, I do not know what sample sizes life insurance companies use, but I imagine that such companies would probably employ further statistical measures to find out where the golden figure of sample size lies. Unfortunately, I don’t know what those statistical procedures are. Nonetheless, if you want to create a make-believe life insurance company, that will just about stay afloat but not much more, then get in touch.
